The HealthPrint Assessments-interesting implications
Introduction: I recorded all of the Shaklee HealthPrint results on a spreadsheet and started running numbers, relationships, groupings, etc. Quickly, it became apparent that we had some interesting relationships and the results align with other research conducted on Lifestyle. This analysis of a small population is interesting and allows those who took the assessment to see how they compare to others. . I am hoping that it leads to discussion and some positive behavior change.
Overview: The Shaklee HealthPrint survey provides feedback on three scales: Nutrition, Lifestyle and Body Mass Index (BMI). The HealthPrint was completed by 52 people. The participants represented a cross section of our community: Shaklee customers, CrossFit 5:00 AM class mates (and other really athletic types) and a larger number of people who attended a school district health fair and completed the Shaklee survey.
The premise of the HealthPrint assessment–proven by research (Blackburn, Epel,others)-is that a healthy lifestyle shortens the time in the Diseasespan at the end of life and offers more time in the Healthspan. It is based on the fact that our health is determined by our genetic code and our lifestyle. That is, we have some control on managing genetic issues passed on to us by our parents and have more control of our lifestyle that will keep us healthy longer.
What the HealthPrint Measures:
- Nutrition: The Nutrition scale measures the amount of healthy and nutritious food consumed on a regular basis, like omega rich foods, daily water intake, limiting unhealthy foods -sugary drinks and snacks, buying organic foods when possible. Nutrition provides the Carbohydrates, Protein, Minerals and Vitamins that let us perform and ultimately keeps us healthy.
- Lifestyle: The Lifestyle measures stress levels, sleep habits, memory and concentration, and exercise levels (frequency and intensity). The lifestyle we chose to live directly affects our health and longevity. It represents the daily choices we make on how we live our lives. Our lifestyle impacts how we manage stress, how we sleep, our memory and our strength, flexibility, stamina and endurance.
- BMI (Body Mass Index) We know that excessive fat harbors metabolic risks that leads to a variety of diseases from diabetes, high blood pressure, cholesterol levels, insulin resistance, inflammation etc. The BMI gives a rough estimate of one’s weight to height measure, but unfortunately it does not provide valid information on a persons’ fat percentage. The goal is to get rid of the belly fat and gain muscles in the process.
Our Data Analysis:
Upon initial review of the data, it was apparent that the physical exercise level was directly related to the overall Nutrition and Lifestyle score. Using correlation and significance testing between groups- T and P test for significance. The three groups formed were:
- The Athletic– intense exercise 4-5 times per week. (many of my CrossFit Group)
- The Fit group- exercised moderately 3 times a week
- The Sedentary group- no regular exercise and at low intensity
Additionally, I used the seminal work by Elizabeth Blackburn and Elissa Epel to further explain the different levels from the results of the HealthPrint survey. Blackburn received a Nobel Price for her work on Telomeres and their implication on health and lifespan. The HealthPrint Assessment mirrors Blackburn’s research. Dr. Blackburn is a member of the Shaklee Advisory Team and was instrumental in developing the Shaklee HealthPrint survey.
With minor modifications- but not losing the focus of Blackburn’s work, I developed the following scale used to show the data in this analysis of my HealthPrint results
| Category | Score | Explanation- Blackburn Research |
| Growth | 71-100 | Increasing healthier scores as one gets a higher score in this category. Telomeres are increasing, more energy, less inflammation, ability to fight oxidative stress, longer life span, Shorter Disease Span at end of life-Medical Cost $ |
| Neutral | 51-70 | A holding pattern with ability to improve the health status or decline as one ages. As we mature, we lose muscle and decrease our metabolic rate at 7-8% per decade. With muscle building and good nutrition we are able to cut the gradual decline to 2-3%- but we need to move to the higher category to keep improving. Medical Costs $$ |
| Danger | 0-50 | Sedentary lifestyle that leads to shorter Telomeres, increased illness, shorter Lifespan, and continuous decline as a person ages and stays in this space. Muscle Atrophy- decrease in Mitochondria and ATP (energy). Longer disease span at end of life. Medical Cost $$$$ |
Results:
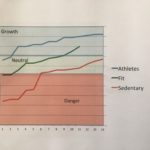
The Athletes (n=23) statistically (.01 significance level) scored higher on the Lifestyle scale than the Fit and Sedentary Group (n=15).
Chart 1. LifeStyle Scores by Exercise Category
The three groups are statistically distinct groups – significant at the .01 level. Note that none of the Sedentary group scored in the Growth Category and only three of the Fit group reach the Growth group. There were three people from the Athlete group that were in the Neutral group and the rest in the Growth Group.
The implication is that this Athlete group can manage stress, sleep better, have a better memory than the Fit and Sedentary groups. The Fit group was also significantly different from the Sedentary group. It also follws that this Athletes and the Fit group are maintaining and growing their Telomeres
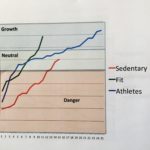
Chart 2- Nutrition Score by Exercise Category
The Fit Group and the Athletes scored significantly higher on the Nutrition scale than the Sedentary Group. There was no significance between the Fit and Athletic groups.
The implication is that nutrition is important to most of the Athletes and the Fit group, but is not the differentiator in leading to higher Lifestyle scores. That is: nutrition may be considered as a supporting issue for the Athletes. In other words_ Athletes need to eat well in order to get the most out of their intensive exercise routine and are careful about their nutrition.
The Fit group appears to take food seriously and eat well, because they want health, but are not driven to eat well because of their Athletic Achievements.
The Sedentary group does not or cannot manage their nutrition. There are a number of explanations that will be covered in a later blog
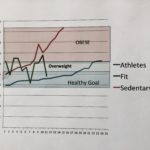
Chart 3 Body Mass Index (BMI) (Lower scores are better)
The Athlete Group has the lowest (healthiest) BMI score. Those Athletes who scored in the 25-31 range are weight lifters and the BMI is not accurate for that group. Given this BMI flaw, all of the Athlete group scores in excellent range.
The Sedentary group has the worst scores and are mostly in the danger area. None are in the recommended healthy zone of 18.5 to 25 BMI score.
The fit group has a range from healthy to unhealthy. What the BMI does not consider is the overall body fat percentage. Someone can be in the healthy range but have a flabby-high percentage fat profile.
Summary:
For the population who took then Shaklee HealthPrint, Intense Exercise is highly correlated to healthier lifestyle and higher nutrition scores, and lowest BMI (except for mesomorphic muscle builders)
From this population, there are three distinct groups that are statistically unique at the .01 confidence level.
The Athletic group has the highest Lifestyle score; the highest Nutrition score and the Lowest BMI score.
It appears that the Athletes are fully committed to being healthy. It is their passion for which they schedule time, have set goals, have a group of friends and are having fun. For the Athletic group nutrition is important to maintain their best athletic performance. “Why should I work out like crazy and then blow it by eating junk.”
The fit group also thinks that fitness and, more so, nutrition are important. They watch their weight and take action to stay within their parameters. They do not get the full benefit of Telomere size increase or the endorphin rush from completing a HIIT workouts, but they do walk, jog or exercise 2-3 times per week. They arepositioned to improve their LifeStyle score.
The Sedentary group needs help. Unless they change their behavior they will increase their time in the Diseasespan at the end of their lives. Given that there are numerous factors that keeps one in this space like, lack of money to buy wholesome food, knowing how to cook, family pressure to buy junk food, depression, illness, fear, living in an unsafe environment, and many more. There are many places to start, but finding the one change that can be done and maintained over time is a crucial first step.
The next blog will explain more of the Telomere story.
If you want to take or retake the Shaklee HealthPrint assessment go to our website at patandjack@myshaklee.com and join as a guest.
You may also want to read The Telomere Effect by E.Blackburn and E. Epel, 2017
If you have time I suggest watching Blackburn and Epel videos where they explain in detail their Nobel winning research.
If you want more information please contact me.


